Urgent Care Group Cuts No-Show Rate from 17% to 6%

A new urgent-care competitor opened across the street from Riverside Urgent Care's flagship location. Survival required closing the no-show gap that had been compressing margins for years.
Business Challenges
The construction signs went up in early 2025. A national urgent-care chain was building a location across the street from Riverside Urgent Care's flagship Akron site — within walking distance of the same patient population, with a national-brand marketing budget behind it. Riverside's COO, James Park, ran the survival math. The flagship site's contribution margin was compressing on multiple fronts.
The no-show rate, which had hovered at 17% for years, was eroding $2.1M in annual capacity revenue that the practice had been quietly absorbing. If that revenue continued to leak when the new competitor opened, Riverside's flagship site would face a meaningful margin-compression scenario.
Riverside operated 11 sites across northeast Ohio. The no-show problem wasn't flagship-specific — it was network-wide — but the competitive pressure made the flagship site the priority. The existing reminder process was single-channel SMS at T-24 hours.
Reminder fatigue was real and measurable; reminder open rates had dropped 18 points over 18 months. Post-visit follow-up was non-existent; return-patient rate sat at 28%, well below the urgent-care benchmark of 42%. Online reviews, a critical, urgent-care competitive lever, averaged 3.7 stars across the network. The competitor was opening with a 4.5-star average from their other markets.
James understood the engagement as competitive survival rather than operational optimization. The framing inside the executive team was that they had nine months — the competitor's construction timeline — to materially close the gap on no-show, retention, and reputation before the competitor's marketing budget hit the market.
- A national urgent-care competitor opened across the street from the flagship site with a 9-month timeline — competitive pressure was specific and dated.
- No-show rate ran 17% network-wide; the flagship site sat at 19%. Annual unrealized capacity revenue: $2.1M.
- Single-channel SMS reminders at T-24 hours showed measurable fatigue; reminder open rates had dropped 18 points over 18 months.
- Return-patient rate sat at 28%; the urgent-care industry benchmark was 42%+.
- Network-average Google rating sat at 3.7; the incoming competitor averaged 4.5 in their other markets.
Solution
James ran a fast procurement. The competitive timeline forced it. The selection criterion: which platform could deliver no-show reduction, return-patient lift, and reputation lift simultaneously within 90 days at the flagship and within 180 days across the network?
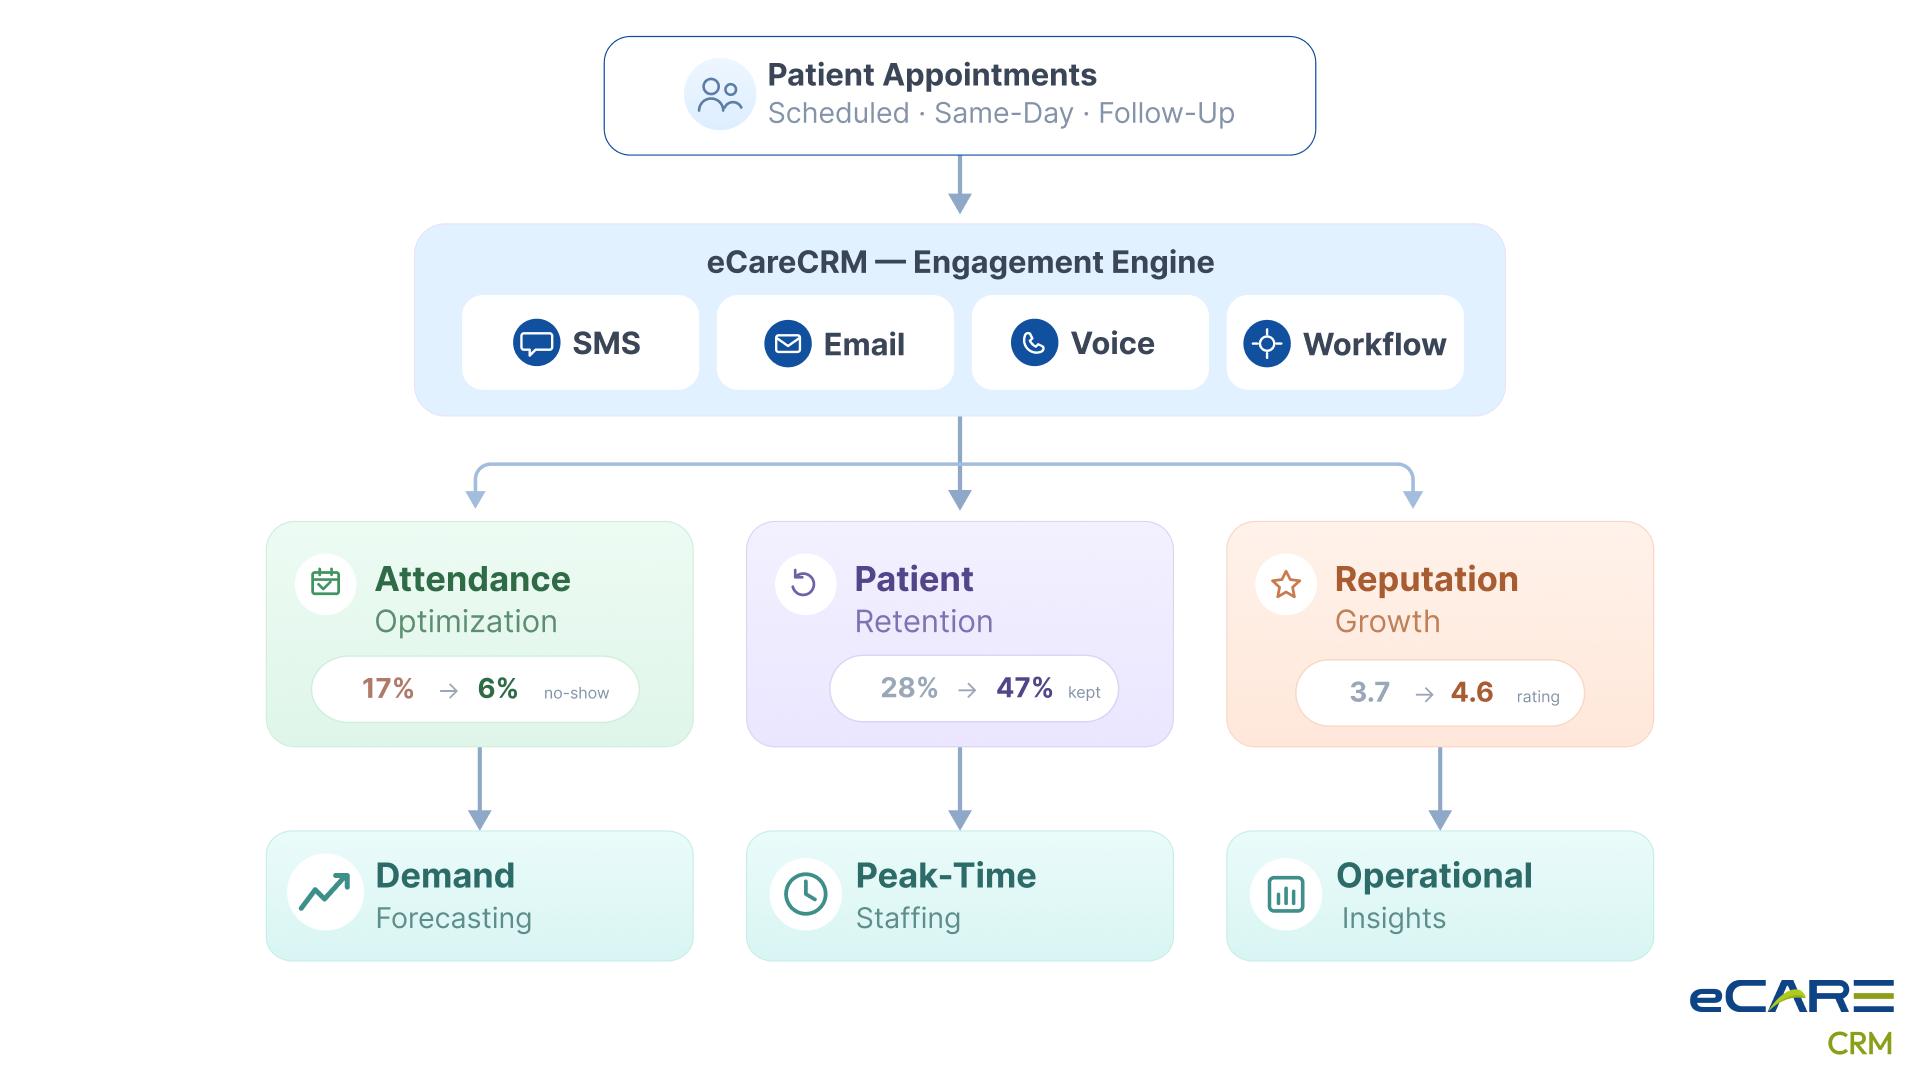
eCareCRM was selected because the platform addressed all three levers from a single workflow rather than requiring three different point solutions. Multi-touch reminder sequences (SMS, email, voice) replaced the single-channel approach. Post-visit follow-up automation (review request, satisfaction survey, recall scheduling) ran as a triggered workflow off visit completion. Reputation management aggregated review responses and surfaced reviewer-by-reviewer context for the front desk to use during follow-up calls.
What also mattered to James was the configuration flexibility. Urgent-care patient behavior is different from primary-care patient behavior — appointments are typically same-day or next-day, reminder fatigue accumulates faster, and review velocity matters more. The eCareCRM team had configurations specifically tuned to urgent-care patterns from prior deployments. James didn't have to invent the playbook.
Value Delivered
The no-show rate dropped within the first 60 days of multi-channel reminder deployment. The return-patient rate took longer — the data needed 6 months to mature. The reputation rating moved fastest because the systematic review-request workflow surfaced positive reviews from satisfied patients who had previously never been asked.
- No-show rate dropped from 17% to 6% network-wide within 90 days; the flagship site reached 4%.
- $1.6M captured from reduced no-shows in the first 12 months.
- Return-patient rate lifted from 28% to 47% at the 12-month mark — exceeding urgent-care benchmarks.
- Network Google rating lifted from 3.7 to 4.6 as positive-patient review velocity ramped up.
- Walk-in / scheduled mix balanced via demand forecasting; peak-time overruns dropped 31%.
Solution Provided
The deployment ran in two waves: flagship first (90 days), network second (90 days). James's logic was that the flagship had to demonstrate operational results before the competitor opened, and the network could follow afterward.
Wave 1 — Flagship Site (Weeks 1–12)
The flagship deployment was treated as a competitive readiness sprint. Multi-channel reminders were live by week 3. The reminder sequence was tuned aggressively — SMS at T-24h, voice-drop at T-12h for no-response, email at T-6h. By week 6, the no-show rate was at 9%. Review-request workflow went live in week 4; by week 8, the flagship's Google rating had moved from 3.6 to 4.3. The competitor opened in week 11; the flagship's prior-period business metrics held through the opening week.
Wave 2 — Sites 2–11 (Weeks 13–24)
The remaining 10 sites came up in pairs across three months. By this point, the configuration playbook was mature. The work was about site-level operational discipline — front-desk teams adopting the review-request follow-up routine, MA teams adopting the post-visit recall workflow. Site-by-site cultural variation was the main implementation challenge; some sites adopted the new workflow within a week, others took a month.
Post-Wave: Demand Forecasting
The platform's demand-forecasting capability went live network-wide in week 22. Each site's historical visit patterns were modeled; peak-time staffing was adjusted based on predicted demand rather than rolling-average historical demand. Peak-time wait times dropped 31%, and patient satisfaction at peak hours specifically lifted 14 points.
Business Value
James presented the 12-month engagement results to Riverside's board in early 2026. The presentation framed the engagement as a survivability story rather than a growth story.
What the engagement preserved
The flagship site's contribution margin held within 4 points of pre-competition levels — meaningfully better than the bear case. The network-wide no-show reduction generated $1.6M in captured revenue that funded ongoing investment in patient experience improvements. The combined impact preserved Riverside's operational independence in a competitive environment that would have compressed it.
What changed about the network's competitive posture
Three of Riverside's other markets are now facing national-chain competitive entry. The playbook that worked at the flagship is being deployed proactively at those sites — not in response to a specific opening, but as a competitive readiness investment. The board has approved an additional $1.4M in platform-driven retention investment for fiscal 2026.
The financial picture
The $1.6M no-show capture, $480K of preserved flagship margin, and $640K of incremental return-patient revenue produced approximately $2.7M annual impact against a $310K implementation investment. The economics are recurring.
The line James uses internally
"The competitor opened on time and with full marketing. We held more than we modeled. The difference between our bear case and our actual was the operational discipline that the platform allowed us to execute. The platform didn't beat the competition. The discipline did. The platform made the discipline possible."